1. Overview
Maritime operations centers depend on aggregating live vessel positions and environmental conditions into a single situational picture — but commercial platforms like MarineTraffic are closed-source and expensive, while building from raw feeds means stitching together unstable government APIs. The Naval Intelligence Platform solves this with a focused, engineering-rigorous full-stack build: live AIS vessel tracking, marine & atmospheric weather overlays, system health monitoring, and fleet analytics — a surveillance interface modeled on what defense contractors use for maritime operations.
Built solo across four milestones — core vessel tracking, environmental intelligence, system operations monitoring, and fleet analytics — all completed on schedule. Beyond the coursework, this project is a direct demonstration of the real-time data processing, multi-source API integration, and event-driven architecture patterns used in fleet health monitoring and systems engineering roles at defense contractors.
2. Architecture
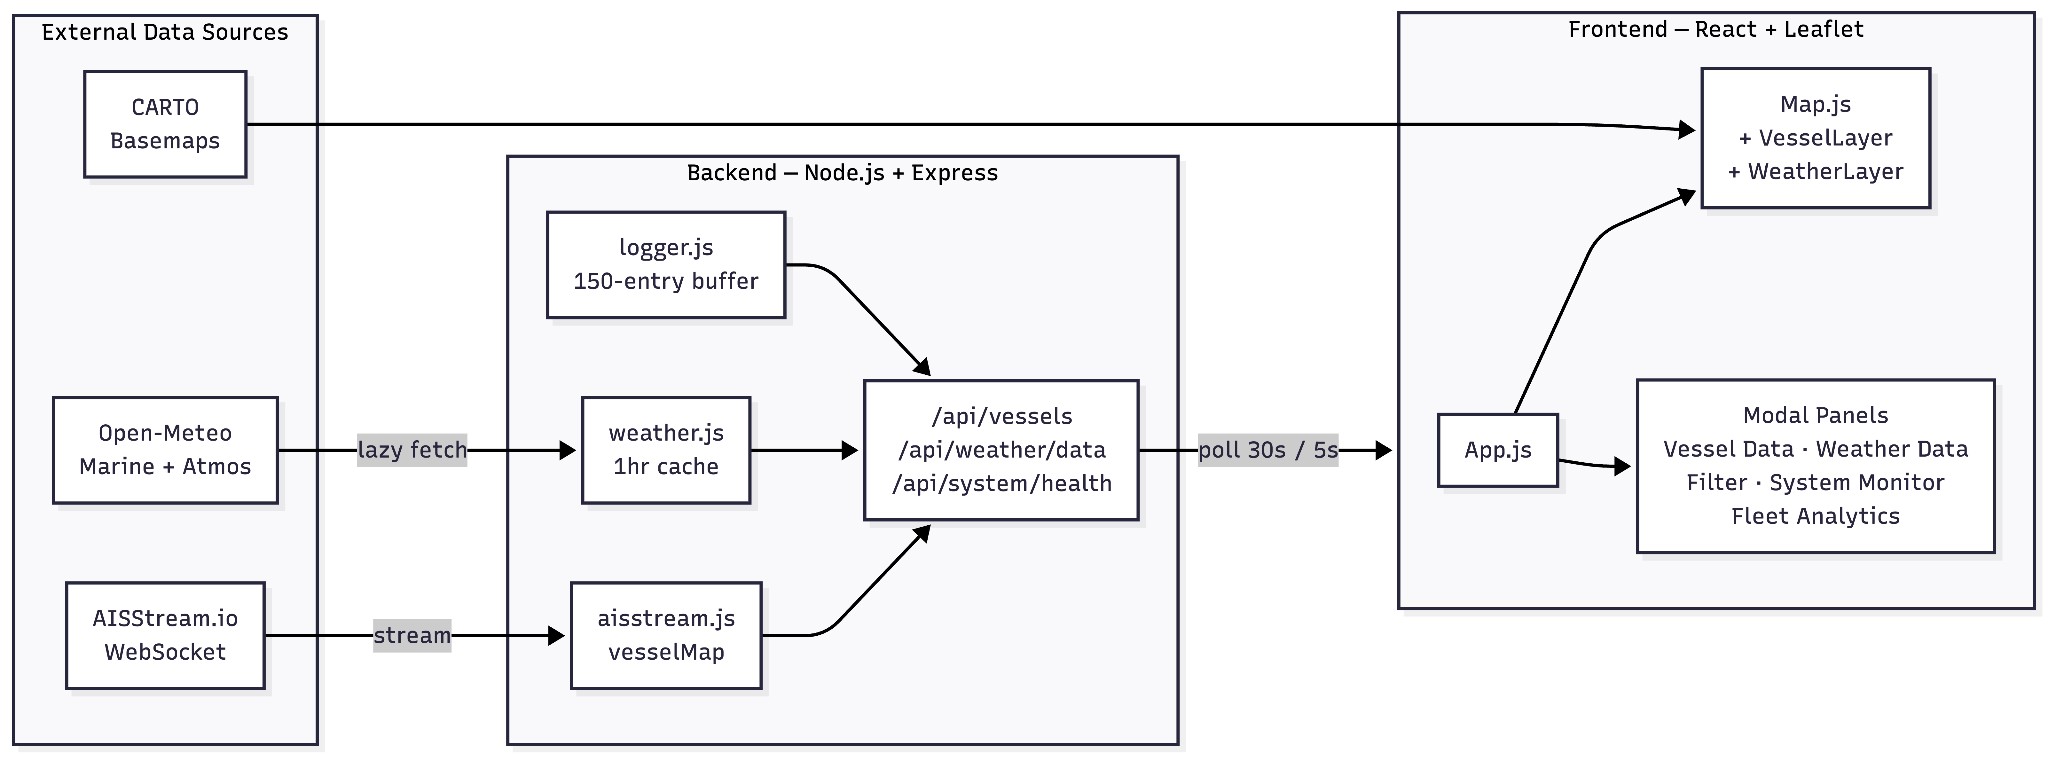
A client-server architecture built around a persistent WebSocket connection and a polling REST layer — the backend maintains live upstream connections so the frontend never has to.
Live Ingest, Polled Delivery
The backend holds a persistent WebSocket to AISStream.io and merges every position update into an in-memory vessel registry keyed by MMSI. The frontend polls a REST endpoint every 30 seconds — simple, stateless, and horizontally scalable, since the backend never has to track connected browser clients.
Differential Marker Updates
Each poll diffs the new vessel snapshot against existing map markers by MMSI — updating position/heading in place, removing vessels that dropped off, and only creating new markers for new arrivals. This eliminates the flicker and layout thrashing of clearing and redrawing ~1,400 markers every cycle.
Lazy, Cached Weather Fetching
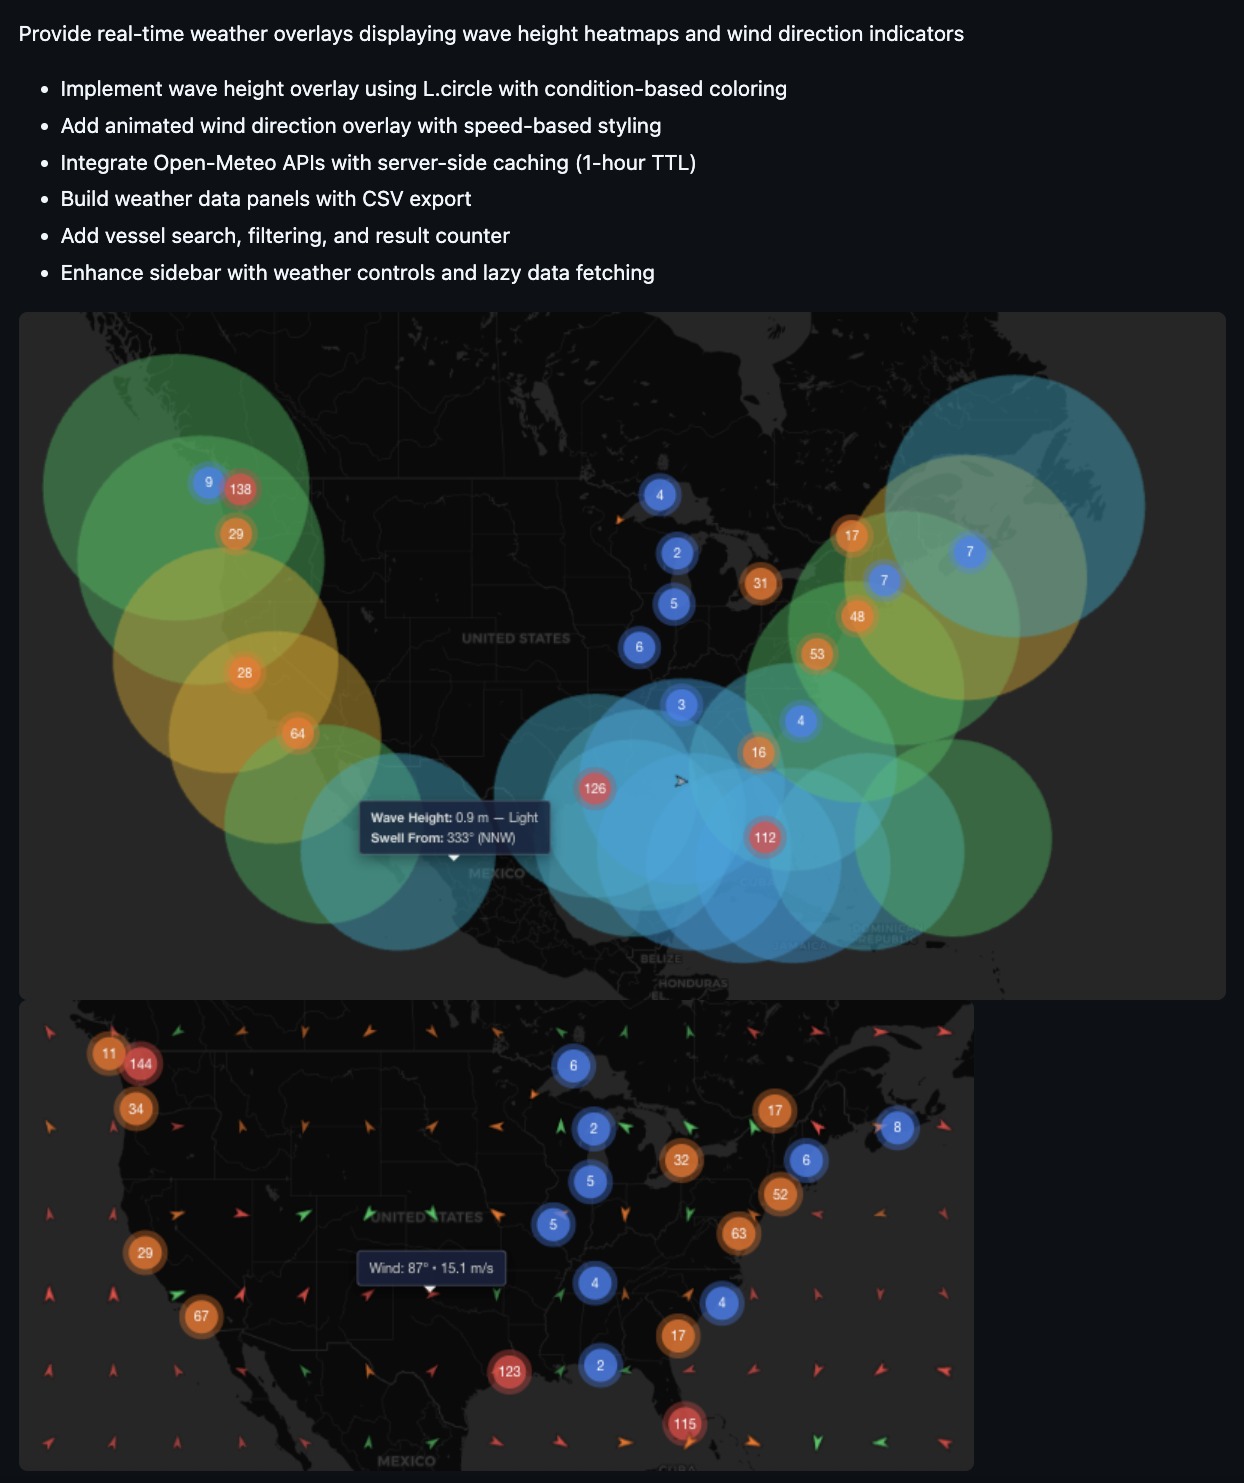
Weather data is fetched server-side and cached for one hour, with wave and wind requests run in parallel via Promise.allSettled so either can fail independently. The client only requests it the first time a weather layer is toggled on — multiple users share one cached fetch, and server-to-server calls sidestep CORS entirely.
Resilient by Design
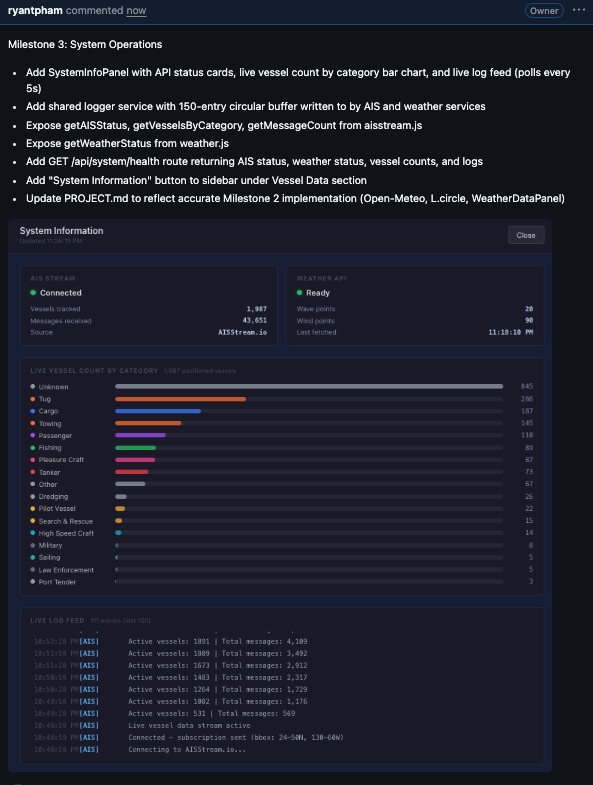
Automatic WebSocket reconnection on unexpected drops, a guarded startup that prevents duplicate connections, and a 150-entry circular log buffer feeding a live system-health dashboard — the same operational visibility patterns used in real command-center monitoring tools.
3. Platform Showcase
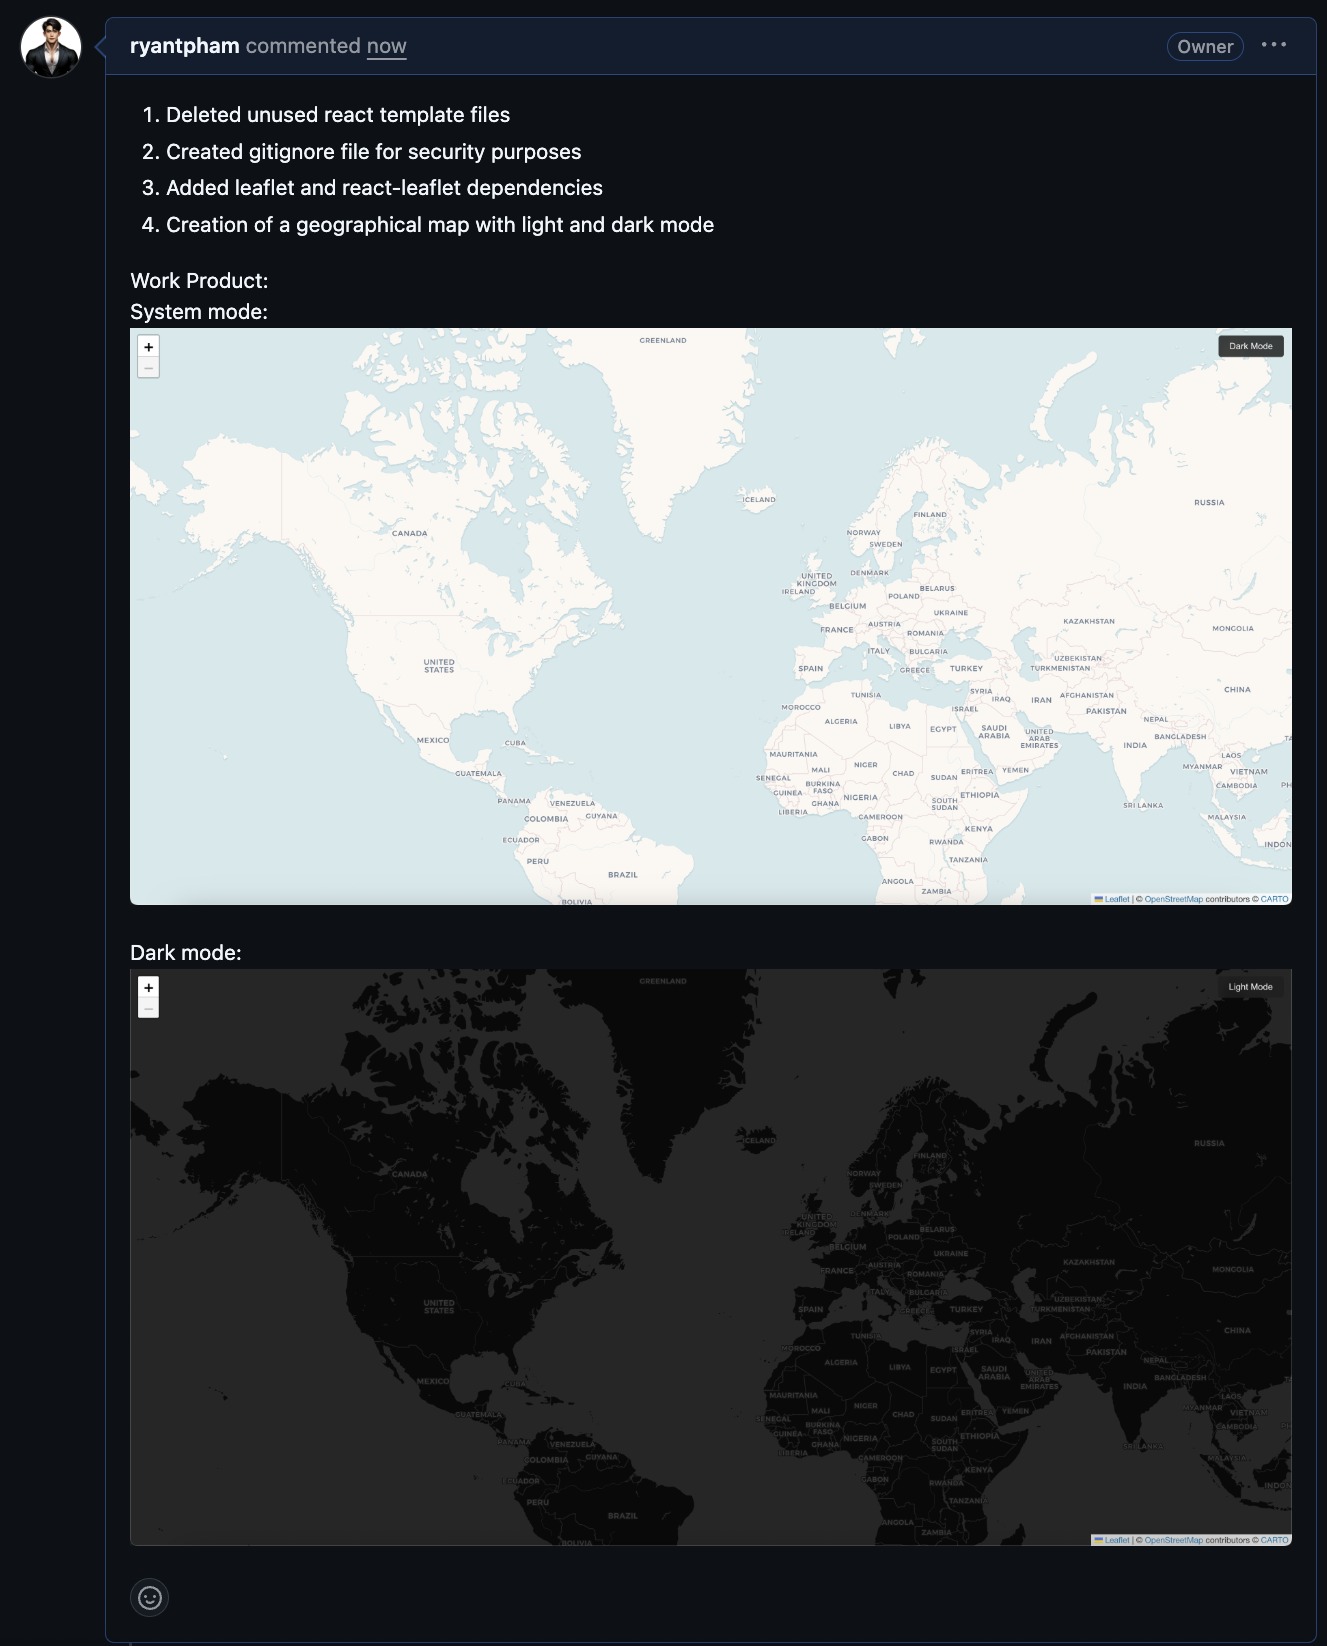
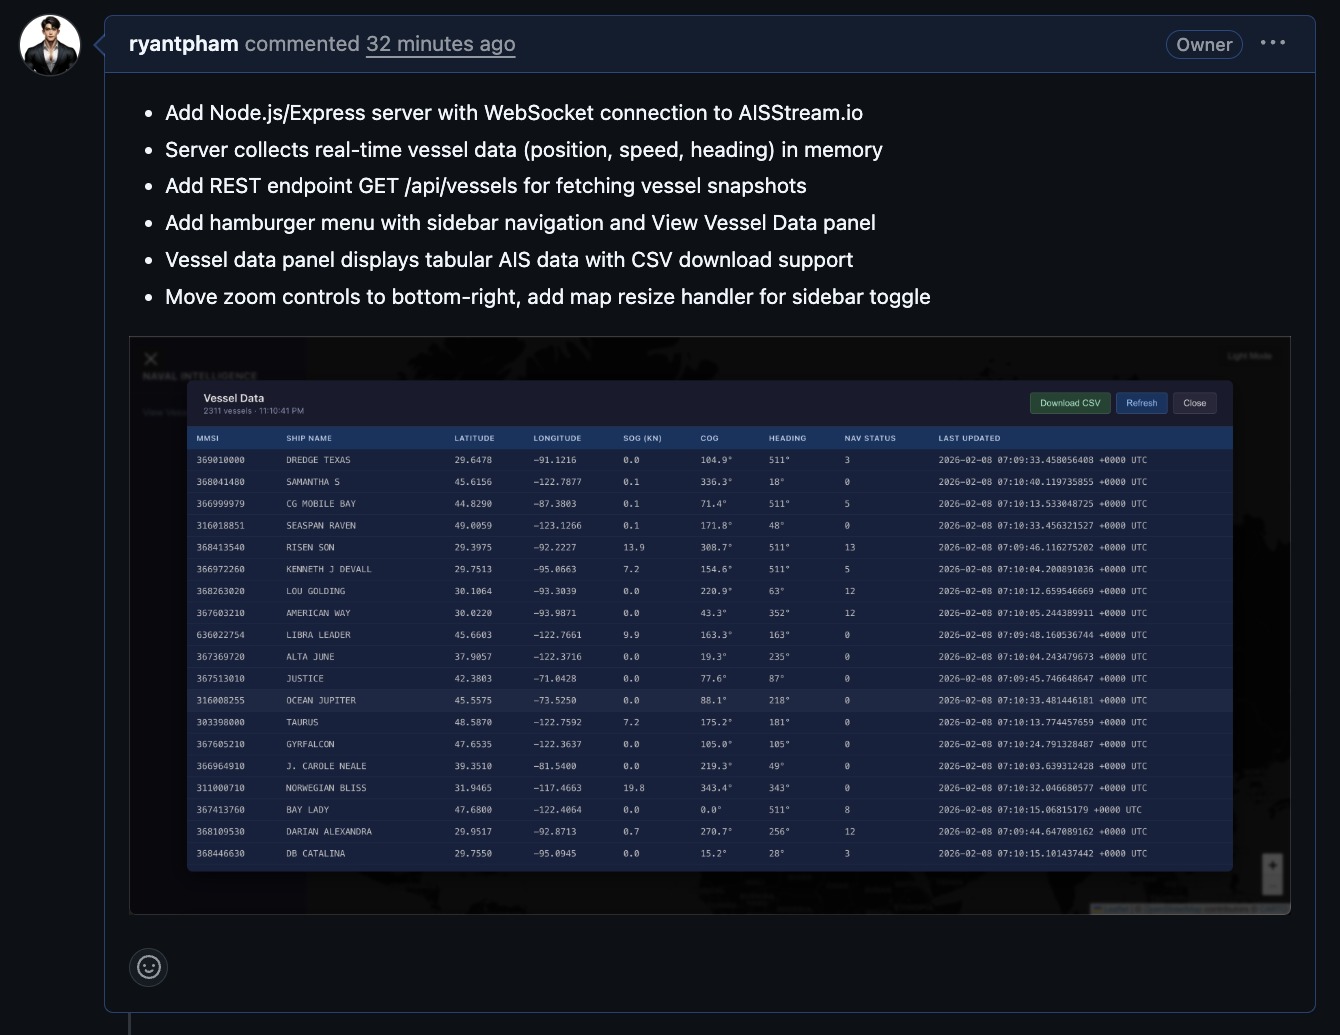
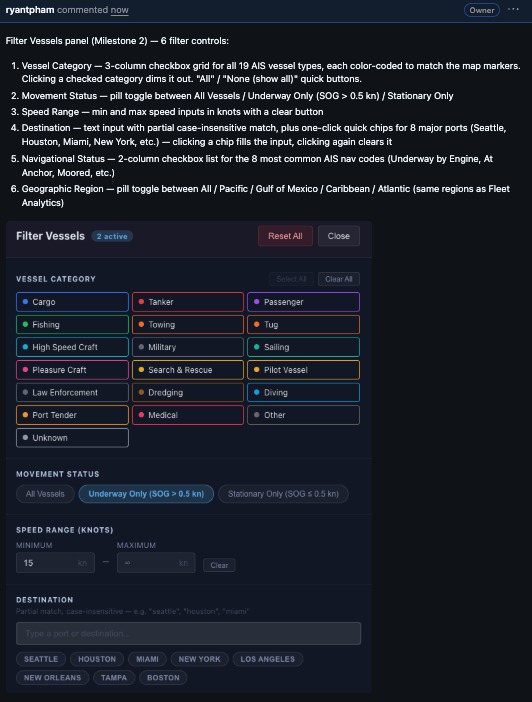
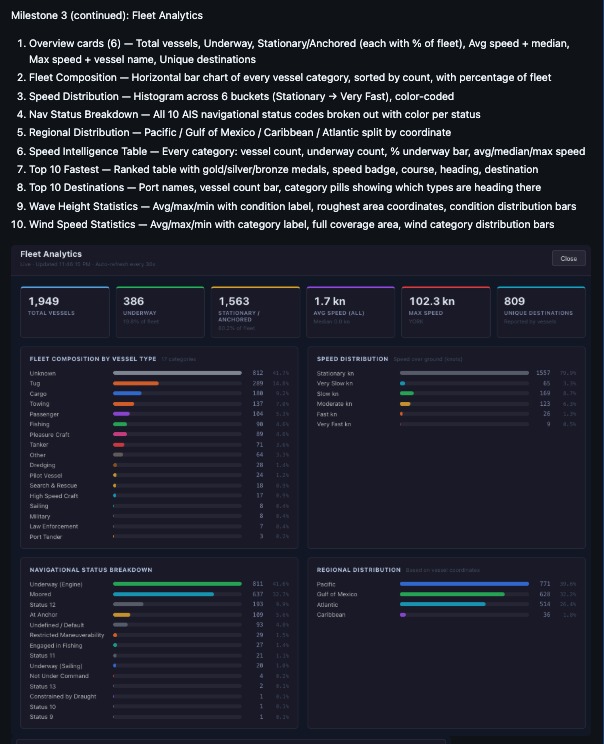
Four milestones, one command interface — live vessel tracking, environmental overlays, operational health monitoring, and fleet-wide analytics.
4. Document Preview
The full 32-page final report, rendered as a scrolling two-page spread — scroll within the frame to read the whole document, or jump to the full PDF downloads below.
5. Full Documents
The complete graduate capstone deliverables: the full written report (architecture, implementation, and lessons learned across all four milestones) and the final presentation deck.